Log Market - July 2024
 |
Scott Downs Director Sales & Marketing PF Olsen Limited |
Market Summary
At Wharf Gate (AWG) prices around New Zealand increased by about 4 NZD in July. Log demand has softened in China during July with some nervousness around August pricing. Wet weather events are causing a drop in log demand while the underlying problem of high local government debt and low consumer spending levels continue to create a pessimistic market.
Domestic demand for logs remains weak as we continue through the New Zealand winter
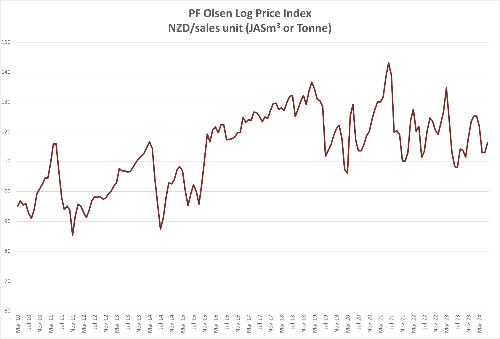
The PF Olsen Log Price Index increased from $116 to $118 in July. This is $1 below the two-year average, and $2 below the five-year average.
Domestic Log Market
The New Zealand property market is facing more headwind than just high interest rates. The property market overhang is the difference between the total number of properties on the market and the number of properties sold at the end of the month. This overhang has been growing over the last three years. At the end of May 2021 there was an overhang of 7,254 properties. At the end of May 2024 the overhang was 28,242 properties. This increase of 289% in overhang is a result of properties for sale increasing 119% while sales have decreased 43%.
New Zealand recorded a net migration loss of 52,500 citizens in the year ended March 2024. This is the first time an annual net migration loss of NZ citizens has exceeded 50,000. Previously the record annual migration loss of citizens was 44,000 in the February 2012 year. There was still an overall net migration gain of 111,000 (citizens and non-citizens combined) driven by the arrival of non-New Zealand citizens, mainly from India, the Philippines, China and Fiji. In May this year there was a total provisional net loss of over 2,000 people.
The general economic slowdown in New Zealand combined with reduced migration numbers means the level of new housing starts will remain low.
Export Log Markets
China
China radiata pine log inventory is about 2.7m m3 and log demand is drifting along at about 55k m3 per day. Rain and wet conditions in Northern China have reduced activity. The modest increases expected in log prices in July were hard to come by. Even as CFR prices for imported logs were rising in June and early July the wholesale log prices were not. The range for A grade is currently $118-124 USD per JASm3 for A grade.
The China Caixin Manufacturing PMI increased in July to 51.8 from 51.7 in June. (Any number above 50 signals manufacturing growth). This is the eighth consecutive month of expansion in factory activity and the highest number since May 2021. Foreign sales continued to grow but at the slowest pace of growth in six months. Buyers are feeling the price pressure due to higher shipping costs. Sentiment has fallen to a four and half year low.
Local Government Funding Vehicles (LGFV’s) became widespread after the global financial crisis of 2008. They are hybrid entities that are both public and corporate and were created to skirt restrictions on local government borrowing. THE IMF estimates that China’s total LGFV debt hit 9.1 trillion USD in 2023, which is more than half of China’s gross domestic product (GDP). China’s plan to solve this crisis has only provided temporary solutions and default risks remain significant.
This problem is two-fold for the construction industry. First many infrastructure and construction projects are funded by local governments (or encouraged by Central Government to buy unsold homes). Second, uncontrolled defaults by these LGFV’s could seriously damage China’s banking system.
Prices for new homes in June fell at the fastest pace in nine years. These issues combined indicate it will be a very slow recovery for the property market in China.
Interestingly Vietnam's exports increased 19.1% for the year end July when compared with the previous year. This is primarily due to Chinese companies and investors looking to diversify their manufacturing and supply chains.
India
Many parts of northern and western India are inundated with floods. Kandla is also affected by the monsoon rains, with vessels often having to wait a week before berthing.
Container freight costs for exports from India to Europe have tripled, putting pressure on Indian exports. This means less demand for pallets and packaging materials produced from logs. Log demand should increase from mid-November, after Diwali is celebrated at the end of October. The IMF has upgraded India's GDP forecast in the FY2024-25 by 20 basis points from 6.8 to 7.0%. The growth momentum in the Indian construction sector is expected to continue over this period, recording a compound annual growth rate (CAGR) of 9.4% during 2024-2028. The construction output in India is expected to reach 435b USD by 2028. This growth is due to investment in construction of hotels, industrial projects, green energy and transport infrastructure projects. The Green Hydrogen Mission alone is forecast to spend 2.4b USD over the next five years.
In July, both Uruguay and Australia loaded one vessel for arrival in August. It is expected that three vessels will be loaded during August from New Zealand which will arrive in Kandla in September.
CFR prices for A grade from Uruguay is at 148 USD, while Australia and New Zealand logs sell for around 143 USD. This is an interesting market dynamic as New Zealand logs used to sell at higher prices than logs from Uruguay. Green lumber is being sold at 581 to 601 INF per CFT and demand is lukewarm. Southern Yellow Pine (SYP) green lumber is sold at 611 INR per CFT.
Exchange rates
The NZD has weakened against the USD in the second half of July, and this will assist with counteracting lower CFR sale prices for logs in China, when August AWG prices are calculated.


CNY:USD
Ocean Freight
Demand for Handymax vessels has remained high due to the increased high level of steel exports from China. As mentioned in last month’s Wood Matters market report, China steel exports have increased due to their domestic construction slow down. Brent Oil prices which had tracked higher through June have reduced in July to be at end of May levels. Shipping costs remain in the high 30's USD per JASm3 from the North Island of New Zealand to China.
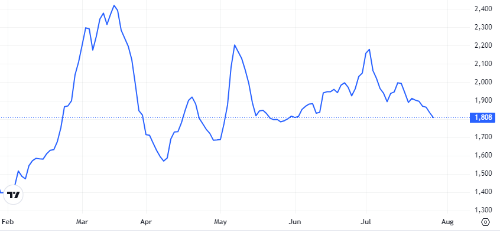
The BDI graph below is a composite of three sub-indices, each covering a different carrier size: Capsize (40%), Panamax (30%), and Supramax (30%). It displays an index of the daily USD hire rates across 20 ocean shipping routes. Whilst most of the NZ log trade is shipped in Handysize vessels, this segment is strongly influenced by the BDI. The BDI is now at an eight-week low.

Source: TradingEconomics.com
Baltic Dry Index (BDI)
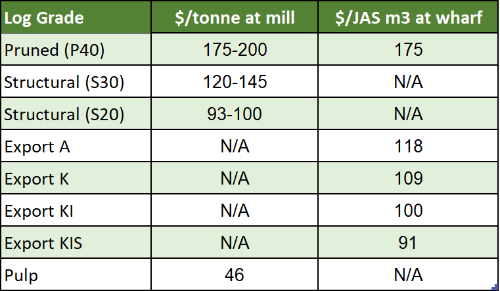
PF Olsen Log Price Index - July 2024
The PF Olsen Log Price Index increased from $116 to $118 in July. This is $1 below the two-year average, and $2 below the five-year average.


Please note these are AWG prices at North Island ports and that South Island prices are commonly lower due to higher port and shipping costs. Actual prices will vary according to regional supply/demand balances, varying cost structures and grade variation.
These prices should be used as a guide only and specific advice sought for individual forests.
