Log Market - February

Market Summary
The At Wharf Gate (AWG) prices for export logs increased an average of $7 in January and $27 in February. The large AWG price increase in February was due to a combination of increased sale prices in China, an easing of shipping costs and a weakening of the NZD against the USD. The CFR sale price in China that bottomed at 130-135 USD per JASm3 for A grade in December, is now above 160 USD in late February. Shipping costs, however, are also rising again.
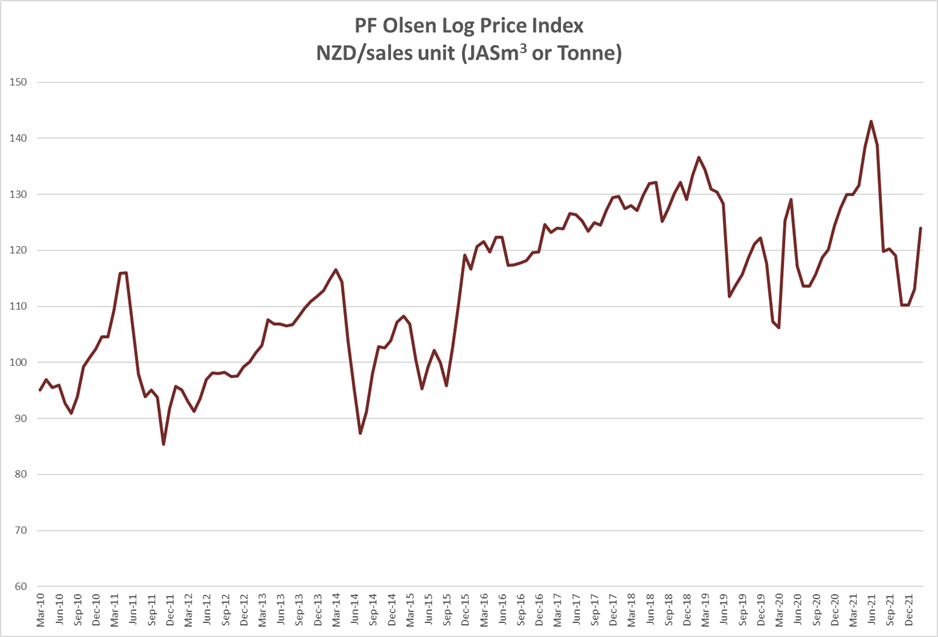
The February PF Olsen log price index of $124 is $1 above the two-year average, $2 above the three year-average and equal to the five-year average.
Domestic Log Market
Log Supply and Pricing
Sawn Timber Markets
Tougher bank lending criteria and increased interest rates may also slow down demand.
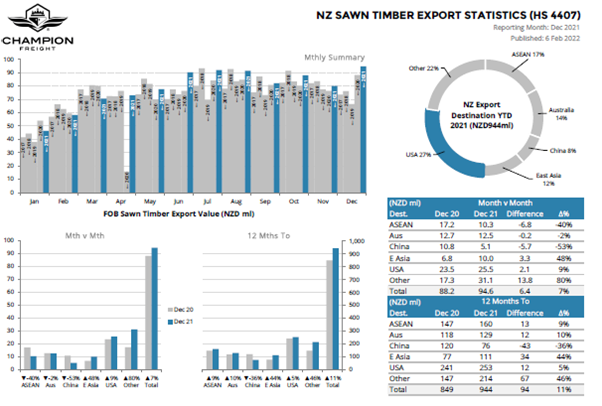
New Zealand sawmills exported 10% and 44% more sawntimber to Australia and East Asia respectively in 2021 than they did in 2020. Overall, there was about 11% more sawntimber exported from New Zealand in total, so Australian sales remained the same proportionally. There was a big reduction in sawn timber sales to China, due to the real estate financial crisis. (Down 44% from 2020 sales).
This reduction in sales to China compared to 2020 started in Quarter 2 and progressively got worse through 2021. The inverse happened with sales to East Asia that increased progressively from Quarter 2 onwards in 2021.
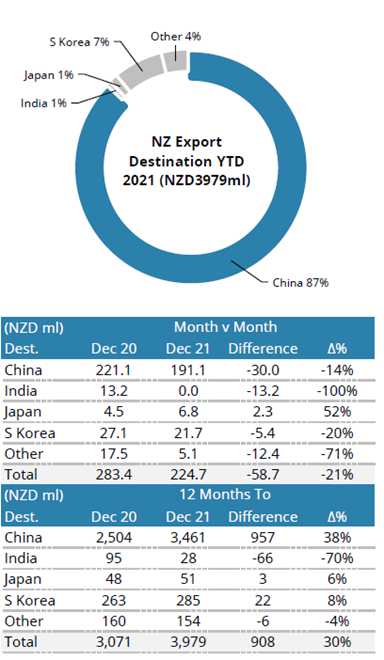
Despite the well-publicised financial crisis in the Chinese real estate and construction sectors they still soaked up the increased export volumes from New Zealand in 2021. Note there was no log supply to India at the end of 2021 due to changes in fumigation requirements. Over the year, log supply to India was down 70% on 2020 supply.
China
The inventory of pine logs at the 23 main log ports in China had dropped in January but is now back to around 4.5m m3 and daily offtake has started again after the Chinese New Year.
Log supply from NZ remains lower than expected. The previously mentioned wet weather and cyclone in New Zealand slowed the rate of harvest. This combined with debarker issues at two ports has caused several log vessels (spread across the array of log exporters) to sail without being completely full or wait for cargo. This is usually quite rare. Log supply from New Zealand is also likely to be reduced over March and April as workers become ill and/or are required to isolate, as New Zealand deals with the expected peak of the Covid Omicron wave.
This constrained log supply should maintain price pressure in China, as alternative supply options are very limited. There is less spruce arriving from Europe, and Russia banned log exports from the start of 2022. (Although one Russian seller informed me that they are allowed to export logs from species such as Birch which they regard as low value).
In the last quarter of 2021, China implemented new rules on the importation of Southern Yellow Pine logs (SYP) from the United States to combat phytosanitary concerns. Many exporters have therefore moved supply to different markets with supply reducing about 50% over the quarter.
Supply from Uruguay has pivoted between China and India, and Quarter 4 2021 was the first time that breakbulk supply from South America to India exceeded supply to China.
Some of the SYP logs previously sent to China from the United States has arrived in Kandla. Logs above 20cm small end diameter (SED) are selling in the 140 USD’s per JASm3. Logs are also arriving from Argentina and Uruguay. Prices for sawn timber in Kandla has increased to 591 INR and 631 INR per CFT for timber from Uruguay pine and SYP respectively.
Tuticorin in Southern India has a log shortage due to the ongoing container shortage. Sawn timber prices are above 700 INR per CFT. Sellers of sawn timber in Tuticorin are also facing competition from the Gandhidham market. Sawn timber is shipped from Kandla (19km from Gandhidham) to Chennai at lower prices and by truck to the Bengaluru and Hyderabad markets.
Exchange rates

NZD: USD

CNY: USD
Ocean Freight
The daily cost to hire a vessel has increased this month for log exporters. The cost of bunker fuel alone has added about 7 USD per JASm3 to shipping costs from New Zealand to China. Shipping rates to China from New Zealand are now above 60 USD per JASm3.
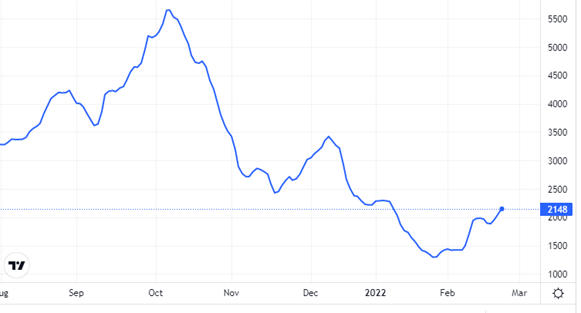
Source: TradingEconomics.com
The Baltic Dry Index (BDI) is a composite of three sub-indices, each covering a different carrier size: Capesize (40%), Panamax (30%), and Supramax (30%). It displays an index of the daily USD hire rates across 20 ocean shipping routes. Whilst most of the NZ log trade is shipped in handy size vessels, this segment is strongly influenced by the BDI.
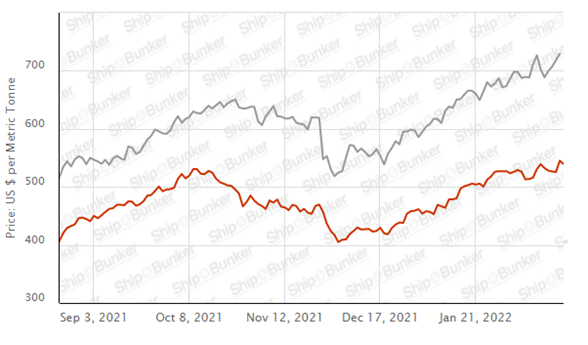
Singapore Bunker Price (IFO380) (red line) versus Brent Oil Price (grey line)
Source: Ship & Bunker
PF Olsen Log Price Index – February 2022
The index of $124 is $1 above the two-year average, $2 above the three year-average and equal to the five-year average.
Indicative Average Current Log Prices – February 2022
|
Log Grade |
$/tonne at mill |
$/JAS m3 at wharf |
|
Pruned (P40) |
180-200 |
150-160 |
|
Structural (S30) |
120-155 |
N/A |
|
Structural (S20) |
100-105 |
N/A |
|
Export A |
N/A |
141 |
|
Export K |
N/A |
132 |
|
Export KI |
N/A |
125 |
|
Export KIS |
N/A |
117 |
|
Pulp |
46 |
N/A |
Note: Actual prices will vary according to regional supply/demand balances, varying cost structures and grade variation. These prices should be used as a guide only and specific advice sought for individual forests.
